

What is the working principle of a spectrometer and what types are there?
With the development of science and technology, human beings have higher and higher requirements for information acquisition. People expect to be able to record all the light information emitted or reflected by substances so as to accurately obtain the information of the target object. The first black-and-white camera was already available in the 19th century. This kind of imaging equipment can only obtain the spatial two-dimensional information of the target object. Later, color cameras appeared, which can additionally obtain spatial information of three channels of red, green and blue (RGB). Since then, color cameras have appeared, which can continuously obtain RGB images of the target, which means that additional time information has been obtained. In recent years, 3D cameras (3D movies) have appeared. This device obtains two RGB videos with different viewing angles by imitating the binocular structure of the human eye, which can be considered to have obtained light angle information. It can be seen from the above development history that acquiring more dimensional optical information is one of the goals of the development history of imaging equipment. Today, our protagonist "spectrometer" is a new type of imaging device that additionally obtains "spectral" information, and is a new star in the history of the development of optical imaging systems.
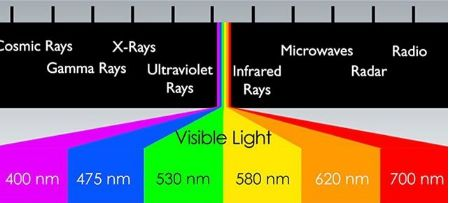
Before understanding the spectrometer, we first need to know what a spectrum is? As we all know, light is an electromagnetic wave, and electromagnetic waves contain forms of different wavelengths. For example, we are familiar with gamma rays, X-rays, ultraviolet, infrared, microwave, radar and so on. Among them, our daily contact with most is visible light. Visible light, as the name implies, within its range, the human eye can perceive light of different wavelengths as different colors. For example, light with a wavelength of 620-780nm is generally perceived by the human eye as red, light with a wavelength of 490-580nm is generally green, and light with a wavelength of 450-490nm is generally blue. The spectrum is the intensity distribution curve of light at different wavelengths.
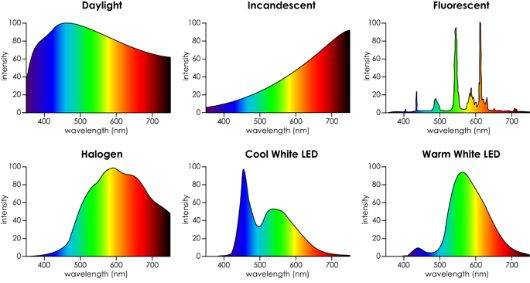
When light irradiates or penetrates a substance, the properties of the light will be modulated by the properties of the substance, and the spectrum of the reflected/transmitted light will also show a variety of changing curves, which can be used to analyze the chemical/molecular composition of the substance, etc. . It is the emission spectrum curve of various light sources. Due to the different physical/chemical properties of the luminescent material of the light source, the emission spectrum also shows corresponding properties. The specific performance is: as the wavelength of the abscissa changes, the light intensity corresponding to different wavelengths is also Change with it. Therefore, the acquisition and application of wavelength intensity information is called spectroscopy. The instrument that can obtain spectral information is called a spectrometer.
After decades of development, the technical form of the spectrometer has been very rich, and scholars have also classified it in a variety of ways. For example: simply according to the range of light can be divided into visible light type, infrared type and ultraviolet type spectrometer. According to the detection method, there are spectrophotometers for direct observation with eyes, spectrophotometers for recording with photosensitive films, and spectrophotometers for detecting spectra with photoelectric or pyroelectric elements. According to whether the process of acquiring the spectrum requires calculation, it can be divided into direct measurement type and calculation type; according to the acquisition method, it can be divided into: prism and grating dispersion type, interference type, direct filter type, spectroscopy type, and calculation tomography with the introduction of micro-optical elements Type and compressed sensing type, etc. Here we are here to introduce three mainstream spectrometers: dispersion type, filter type, and interference type spectrometer. The three are from the shallower to the deeper, layer by layer, I believe it can give everyone a clear understanding of the principle of the spectrometer. Dispersive spectrometer: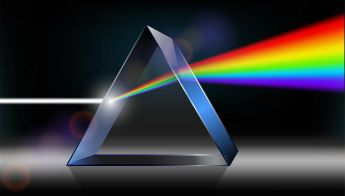
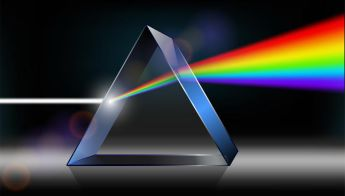
Newton's prism dispersion experiment (Figure 4) made people realize that white light is composed of light of multiple colors. Dispersion has always been an important form for people to separate light of different spectral bands. The dispersive spectrometer is to split the polychromatic light through the light splitting element (such as prism, grating), and then arrange the dispersed monochromatic light in order according to the wavelength to obtain the spectrum. Currently, most commercial spectrometers on the market are based on diffraction grating spectrometer systems (Grating Spectrometer). The diffractive grating of the light splitting element is an optical device capable of diffracting polychromatic light to different angles. Its basic principle can be expressed by the following formula:
Among them, n is the diffraction order, is the wavelength of the diffracted light, d is the grating constant, is the light incident angle, and is the light exit angle. The light of each color dispersed by the grating is re-imaged by the detector, and the spectrum is obtained by arranging in the order of wavelength from small to large. In the dispersive element of the dispersive spectrometer, the grating is usually better than the prism. Because of the limitation of prism dispersion: there is a certain light absorption effect in a specific wavelength range, which leads to limited dispersion efficiency. The grating does not have this problem, its dispersion efficiency is higher, and it can provide linear dispersion according to the wavelength, and it is easier to post-process.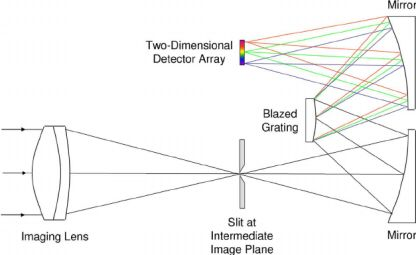
The principle of dispersive spectrometer is simple, but there are corresponding shortcomings. As shown in the figure, due to the introduction of slits in the dispersive spectroscopy system, the luminous flux is low, and the luminous flux directly affects the signal-to-noise ratio of the information. The luminous flux can be increased by increasing the width of the slit, but the increase of the slit width will result in a decrease in the spectral resolution. Therefore, the signal-to-noise ratio and spectral resolution of dispersive spectrometers are mutually restricted, and become the primary problem they face. At the same time, since each spectral line needs to be measured separately after dispersion, the measurement time of the system is lengthened, which restricts the application of the dispersion spectrometer in dynamic scenes. Filter-type spectrometer: Filter-type spectrometers usually use interference filters (commonly Fabry-Perot type) to directly filter out the light in the required wavelength band, and absorb or discharge the light in the unnecessary wavelength band. The basic principle is the same as the color cameras we see everyday. The color camera can be considered as a three-channel multispectral camera. This structure was proposed by Bayer in 1976. As shown in the figure, it is a structure in which a red, green, and blue filter array is processed directly in front of the pixels. After combining the information of the three primary colors of red, green and blue, the color recording can be completed.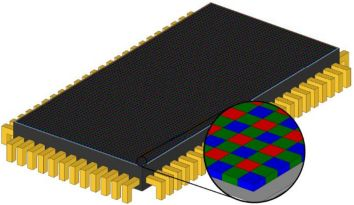
A color camera with a mosaic structure of Bayer filters.
With the development of Bayer filter array color cameras, it is possible to produce single-pixel-level spectral filters. As shown in the figure, through the simple step of increasing the number of filters, color cameras can be extended to spectrometers. The advantage of such a spectrometer is that it is very compact, portable and robust. But its main disadvantage is that it is very difficult to manufacture such a pixel-level filter, the size of each filter must be exactly the same, and the filter must be absolutely registered with the detector pixel. This not only makes this type of spectrometer extremely expensive, but once the system is equipped, there is no possibility of secondary adjustment (the spectral range or resolution cannot be changed arbitrarily).
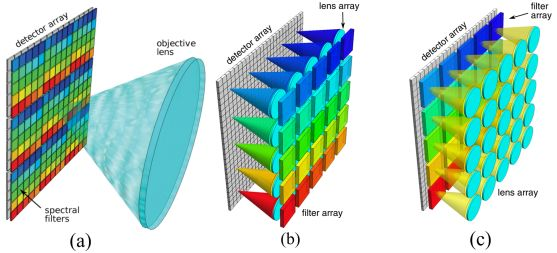
(a) Pixel-level filter spectrometer; (b-c) Two multi-aperture filter spectrometers.
In order to solve the above problems, scholars have proposed a multi-aperture filter spectrometer (MAFC). As shown in the figure, the corresponding function can be realized by combining the microlens array with the relatively large filter. At this time, the filter is large in size, easy to process, can be placed in front of and behind the lens, and registration is relatively easy. The disadvantage of this kind of spectrometer is that as the number of spectral channels increases, it is necessary to increase the number of filters, which leads to a decrease in luminous flux. Interferometric spectrometer: In 1880, Michelson invented the Michelson interferometer. After that, Rayleigh realized that through Fourier transform, the spectral information can be obtained from the interferogram produced by the interferometer, and interference spectroscopy is slow. Slowly develop. In 1949, the British scientist Peter Fellgett obtained the spectrum from the experimentally measured interferogram through the Fourier integral transform for the first time.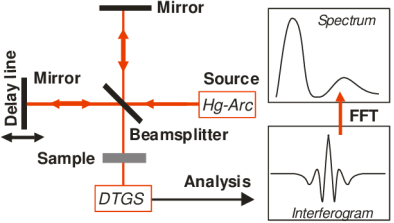 Interference-type spectrometers are mostly double-beam interference-type, among which the most famous is the Michelson interference-type spectrometer. The spectrometer includes a beam splitter, a fixed mirror and a moving mirror. The light from the target scene is first divided into two paths by the beam splitter, one of which is reflected by the beam splitter to the fixed mirror, and after being reflected by the fixed mirror, it passes through the beam splitter to reach the detector; the other way passes through the beam splitter to reach the moving mirror. After being reflected by the moving mirror, it reaches the beam splitter again, and is finally reflected by the beam splitter to reach the detector. By moving the moving mirror, there is an optical path difference between the two optical paths, and the existence of the optical path difference causes the two paths of light to interfere to form interference fringes. The Fourier transform of the interference fringes can obtain the spectral curve of the target scene. Interference spectrometer overcomes the shortcomings of low energy utilization of dispersive spectrometer, and has the advantages of wide measurement range, high precision, and high spectral resolution. It is widely used in infrared and visible light bands.
Application fields of spectrometer:
Spectral measurement can be widely used in many different fields, such as color measurement, measurement in the semiconductor field, and concentration measurement of chemical components. The core of spectroscopy measurement is that the radiated or scattered, transmitted or reflected light of a substance carries information about the properties and conditions of the substance, such as parameters such as chemical and physical components. General spectrum detection, including original spectrum, transmission and reflection, absorption, radiation, Raman, fluorescence, etc.
Introduction of commonly used spectrometers for photographic fill light
Specification Description
Wavelength range: 380-780nm, 5.0-inch IPS high-definition touch screen, 4G memory 1200 line grating, CCD, precision circuit, high-speed AD sampling, save file format: GDF, Excle, PDF
●Sampling time T(ms)——50-10000ms set sampling time
●Average illuminance E (lx)-set the average illuminance value within the sampling time period
●Maximum illuminance Eax(lx) ——Set the maximum illuminance value within the sampling time period
●Minimum illuminance Emin(lx) ——Set the minimum illuminance value within the sampling time period
●Frequency F(Hz)——0-250KHz The sampling frequency is automatically within the sampling time period
●Depth of fluctuation (%)——Depth of fluctuation [Depth of fluctuation=(AB) / (A+B)*100%] and stroboscopic index [flicker index=Q1/(Q1+Q2)] stroboscopic: the luminous flux of the electric light source The depth of the fluctuation, the greater the depth of the fluctuation, the greater the depth of the strobe. Depth of fluctuation = (strongest light value-weakest light value) / strongest light value * 100%
● Modulation depth% flashing percentage-the ratio of the difference between the maximum and minimum light output to the sum of the maximum and minimum light output
●Flicker index-the area above the average light output in a period occupies the total light output area. Stroboscopic index [flicker index=Q1/(Q1+Q2)] Stroboscopic effect: the negative effect of electric light source stroboscopic on human vision. The greater the strobe depth, the greater the negative effect and the more serious the harm.
●Risk Warning
●Maximum Illumination Waveform
●Depth graph of fluctuation
●Spectrogram
● Blue light hazard irradiance (mW/㎡)
● Maximum exposure time (S)
● Blue light hazard level BER(Mw/Lm)
● Blue light component
● Correlated color temperature Tc (K), black body deviation from Duv
● Illumination E (lx)
● Candlelight E (Fc)
● Radiation illuminance Ee (W/m²)
● Chromaticity coordinates (x, y), (u, v), (u′, v′)
● Relative spectral power distribution P (λ)
● Color rendering index Ra, Ri (i=1~15)
● Color rendering index (long bar diagram)
Remote sensing field
By placing the spectrometer on the artificial satellite or aircraft, the electromagnetic radiation information detection of the ground object can be realized. Various substances on the surface have specific electromagnetic wave reflection, absorption, transmission and radiation characteristics. For example, various rock mines, different types of soil, different types of water bodies, different types of vegetation, urban buildings, and gas components in the atmosphere all have different effects on electromagnetic radiation. Therefore, through the establishment of a spectral database of various substances, various types of ground objects can be accurately classified, so as to realize applications in surveying and mapping, geological prospecting, atmospheric and water environmental monitoring and so on.
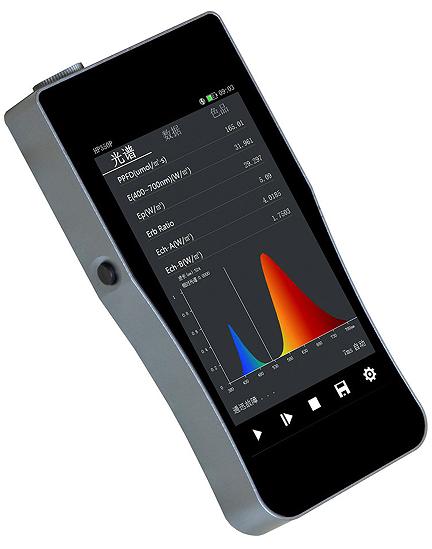
Professional spectral measurement of photographic fill light
The following are tested by professional testing equipment, two-color intelligent spectrometer, and the lighting products are provided by the American photography fill light brand VLOGLITE. The following are product specifications.
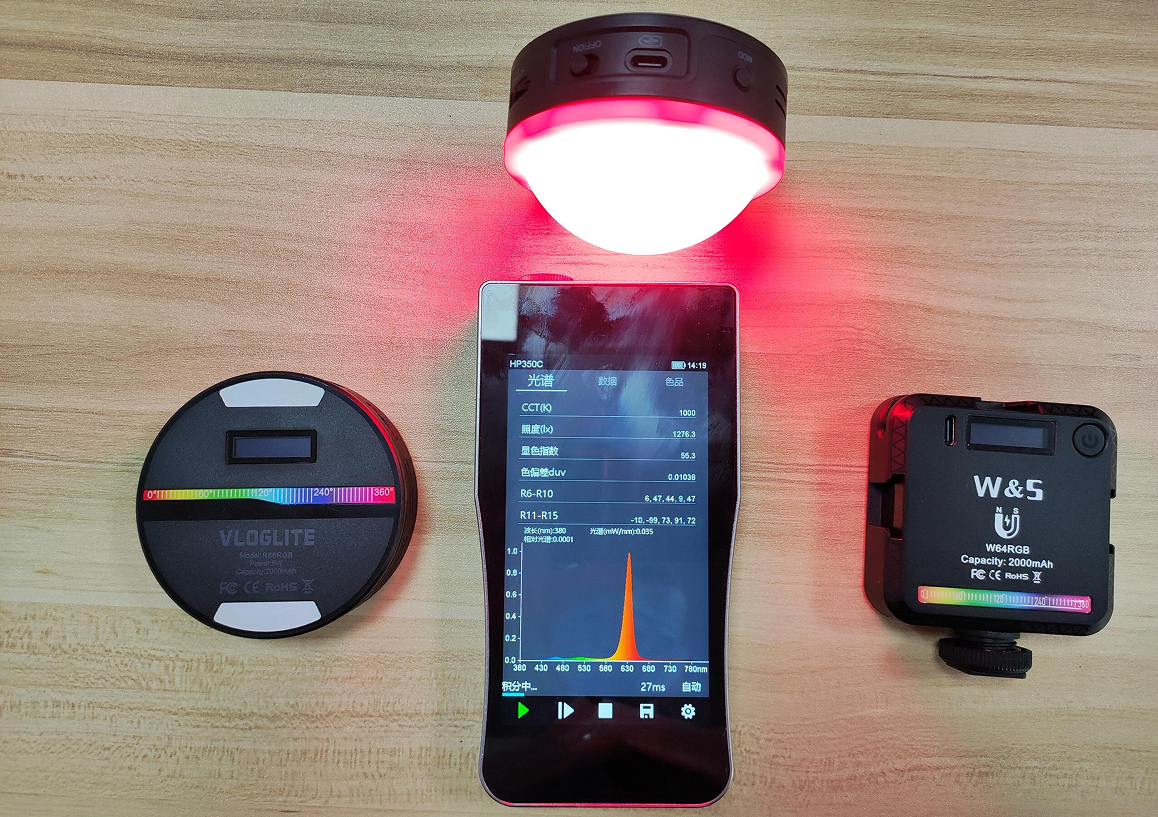
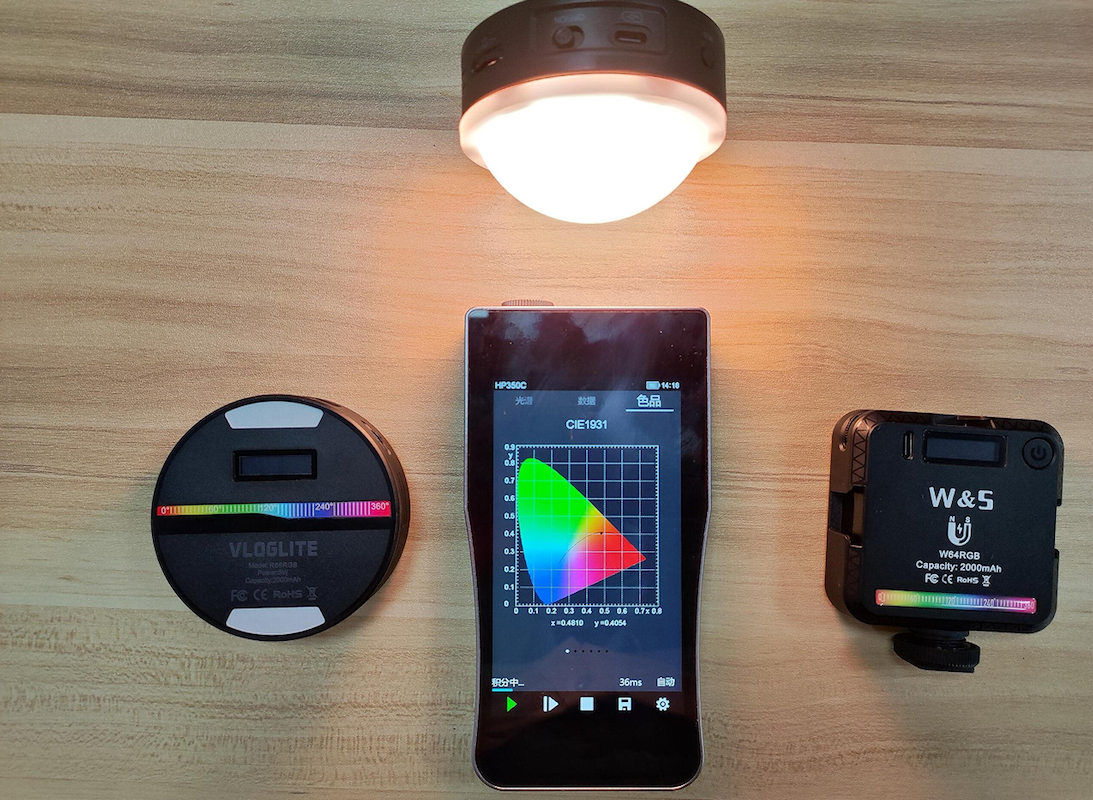
The date of the light is on the base of average,slight difference shall exist among different lights
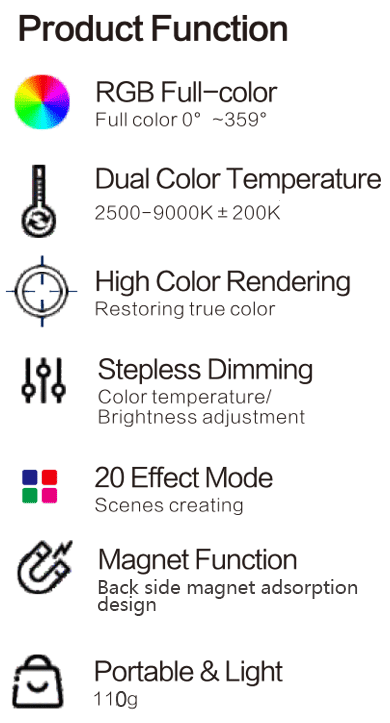
Features of the VLOGLITE-R66RGB fill light
Allowing you to simulate a more ideal scene lighting effect. It's a photography light that can make you look cool.
Vloglite profile
Vloglite was founded by tony·Zhang and is a consumer-grade video fill light brand from China. From video fill light camera accessories, everything vloglite does is to shoot wonderful lives, share experiences, and deliver happiness. vloglite believes that sharing will make the experience more meaningful and interesting. The main products of vloglite include video fill light, photography accessories, camera accessories and so on.Vloglite brand video fill light wholesale and retail. Welcome to cooperate with online and offline agents and distributors. You can go to the following website to place an order.
Photography VLOG enthusiasts and wholesale agents
Order me: www.vloglite.com; service@vloglite.com
With the development of science and technology, human beings have higher and higher requirements for information acquisition. People expect to be able to record all the light information emitted or reflected by substances so as to accurately obtain the information of the target object. The first black-and-white camera was already available in the 19th century. This kind of imaging equipment can only obtain the spatial two-dimensional information of the target object. Later, color cameras appeared, which can additionally obtain spatial information of three channels of red, green and blue (RGB). Since then, color cameras have appeared, which can continuously obtain RGB images of the target, which means that additional time information has been obtained. In recent years, 3D cameras (3D movies) have appeared. This device obtains two RGB videos with different viewing angles by imitating the binocular structure of the human eye, which can be considered to have obtained light angle information. It can be seen from the above development history that acquiring more dimensional optical information is one of the goals of the development history of imaging equipment. Today, our protagonist "spectrometer" is a new type of imaging device that additionally obtains "spectral" information, and is a new star in the history of the development of optical imaging systems.
Before understanding the spectrometer, we first need to know what a spectrum is? As we all know, light is an electromagnetic wave, and electromagnetic waves contain forms of different wavelengths. For example, we are familiar with gamma rays, X-rays, ultraviolet, infrared, microwave, radar and so on. Among them, our daily contact with most is visible light. Visible light, as the name implies, within its range, the human eye can perceive light of different wavelengths as different colors. For example, light with a wavelength of 620-780nm is generally perceived by the human eye as red, light with a wavelength of 490-580nm is generally green, and light with a wavelength of 450-490nm is generally blue. The spectrum is the intensity distribution curve of light at different wavelengths.
When light irradiates or penetrates a substance, the properties of the light will be modulated by the properties of the substance, and the spectrum of the reflected/transmitted light will also show a variety of changing curves, which can be used to analyze the chemical/molecular composition of the substance, etc. . It is the emission spectrum curve of various light sources. Due to the different physical/chemical properties of the luminescent material of the light source, the emission spectrum also shows corresponding properties. The specific performance is: as the wavelength of the abscissa changes, the light intensity corresponding to different wavelengths is also Change with it. Therefore, the acquisition and application of wavelength intensity information is called spectroscopy. The instrument that can obtain spectral information is called a spectrometer.
After decades of development, the technical form of the spectrometer has been very rich, and scholars have also classified it in a variety of ways. For example: simply according to the range of light can be divided into visible light type, infrared type and ultraviolet type spectrometer. According to the detection method, there are spectrophotometers for direct observation with eyes, spectrophotometers for recording with photosensitive films, and spectrophotometers for detecting spectra with photoelectric or pyroelectric elements. According to whether the process of acquiring the spectrum requires calculation, it can be divided into direct measurement type and calculation type; according to the acquisition method, it can be divided into: prism and grating dispersion type, interference type, direct filter type, spectroscopy type, and calculation tomography with the introduction of micro-optical elements Type and compressed sensing type, etc. Here we are here to introduce three mainstream spectrometers: dispersion type, filter type, and interference type spectrometer. The three are from the shallower to the deeper, layer by layer, I believe it can give everyone a clear understanding of the principle of the spectrometer. Dispersive spectrometer:
Newton's prism dispersion experiment (Figure 4) made people realize that white light is composed of light of multiple colors. Dispersion has always been an important form for people to separate light of different spectral bands. The dispersive spectrometer is to split the polychromatic light through the light splitting element (such as prism, grating), and then arrange the dispersed monochromatic light in order according to the wavelength to obtain the spectrum. Currently, most commercial spectrometers on the market are based on diffraction grating spectrometer systems (Grating Spectrometer). The diffractive grating of the light splitting element is an optical device capable of diffracting polychromatic light to different angles. Its basic principle can be expressed by the following formula:
Among them, n is the diffraction order, is the wavelength of the diffracted light, d is the grating constant, is the light incident angle, and is the light exit angle. The light of each color dispersed by the grating is re-imaged by the detector, and the spectrum is obtained by arranging in the order of wavelength from small to large. In the dispersive element of the dispersive spectrometer, the grating is usually better than the prism. Because of the limitation of prism dispersion: there is a certain light absorption effect in a specific wavelength range, which leads to limited dispersion efficiency. The grating does not have this problem, its dispersion efficiency is higher, and it can provide linear dispersion according to the wavelength, and it is easier to post-process.
The principle of dispersive spectrometer is simple, but there are corresponding shortcomings. As shown in the figure, due to the introduction of slits in the dispersive spectroscopy system, the luminous flux is low, and the luminous flux directly affects the signal-to-noise ratio of the information. The luminous flux can be increased by increasing the width of the slit, but the increase of the slit width will result in a decrease in the spectral resolution. Therefore, the signal-to-noise ratio and spectral resolution of dispersive spectrometers are mutually restricted, and become the primary problem they face. At the same time, since each spectral line needs to be measured separately after dispersion, the measurement time of the system is lengthened, which restricts the application of the dispersion spectrometer in dynamic scenes. Filter-type spectrometer: Filter-type spectrometers usually use interference filters (commonly Fabry-Perot type) to directly filter out the light in the required wavelength band, and absorb or discharge the light in the unnecessary wavelength band. The basic principle is the same as the color cameras we see everyday. The color camera can be considered as a three-channel multispectral camera. This structure was proposed by Bayer in 1976. As shown in the figure, it is a structure in which a red, green, and blue filter array is processed directly in front of the pixels. After combining the information of the three primary colors of red, green and blue, the color recording can be completed.
A color camera with a mosaic structure of Bayer filters.
With the development of Bayer filter array color cameras, it is possible to produce single-pixel-level spectral filters. As shown in the figure, through the simple step of increasing the number of filters, color cameras can be extended to spectrometers. The advantage of such a spectrometer is that it is very compact, portable and robust. But its main disadvantage is that it is very difficult to manufacture such a pixel-level filter, the size of each filter must be exactly the same, and the filter must be absolutely registered with the detector pixel. This not only makes this type of spectrometer extremely expensive, but once the system is equipped, there is no possibility of secondary adjustment (the spectral range or resolution cannot be changed arbitrarily).
(a) Pixel-level filter spectrometer; (b-c) Two multi-aperture filter spectrometers.
In order to solve the above problems, scholars have proposed a multi-aperture filter spectrometer (MAFC). As shown in the figure, the corresponding function can be realized by combining the microlens array with the relatively large filter. At this time, the filter is large in size, easy to process, can be placed in front of and behind the lens, and registration is relatively easy. The disadvantage of this kind of spectrometer is that as the number of spectral channels increases, it is necessary to increase the number of filters, which leads to a decrease in luminous flux. Interferometric spectrometer: In 1880, Michelson invented the Michelson interferometer. After that, Rayleigh realized that through Fourier transform, the spectral information can be obtained from the interferogram produced by the interferometer, and interference spectroscopy is slow. Slowly develop. In 1949, the British scientist Peter Fellgett obtained the spectrum from the experimentally measured interferogram through the Fourier integral transform for the first time.
Application fields of spectrometer:
Spectral measurement can be widely used in many different fields, such as color measurement, measurement in the semiconductor field, and concentration measurement of chemical components. The core of spectroscopy measurement is that the radiated or scattered, transmitted or reflected light of a substance carries information about the properties and conditions of the substance, such as parameters such as chemical and physical components. General spectrum detection, including original spectrum, transmission and reflection, absorption, radiation, Raman, fluorescence, etc.
Introduction of commonly used spectrometers for photographic fill light
Specification Description
Wavelength range: 380-780nm, 5.0-inch IPS high-definition touch screen, 4G memory 1200 line grating, CCD, precision circuit, high-speed AD sampling, save file format: GDF, Excle, PDF
●Sampling time T(ms)——50-10000ms set sampling time
●Average illuminance E (lx)-set the average illuminance value within the sampling time period
●Maximum illuminance Eax(lx) ——Set the maximum illuminance value within the sampling time period
●Minimum illuminance Emin(lx) ——Set the minimum illuminance value within the sampling time period
●Frequency F(Hz)——0-250KHz The sampling frequency is automatically within the sampling time period
●Depth of fluctuation (%)——Depth of fluctuation [Depth of fluctuation=(AB) / (A+B)*100%] and stroboscopic index [flicker index=Q1/(Q1+Q2)] stroboscopic: the luminous flux of the electric light source The depth of the fluctuation, the greater the depth of the fluctuation, the greater the depth of the strobe. Depth of fluctuation = (strongest light value-weakest light value) / strongest light value * 100%
● Modulation depth% flashing percentage-the ratio of the difference between the maximum and minimum light output to the sum of the maximum and minimum light output
●Flicker index-the area above the average light output in a period occupies the total light output area. Stroboscopic index [flicker index=Q1/(Q1+Q2)] Stroboscopic effect: the negative effect of electric light source stroboscopic on human vision. The greater the strobe depth, the greater the negative effect and the more serious the harm.
●Risk Warning
●Maximum Illumination Waveform
●Depth graph of fluctuation
●Spectrogram
● Blue light hazard irradiance (mW/㎡)
● Maximum exposure time (S)
● Blue light hazard level BER(Mw/Lm)
● Blue light component
● Correlated color temperature Tc (K), black body deviation from Duv
● Illumination E (lx)
● Candlelight E (Fc)
● Radiation illuminance Ee (W/m²)
● Chromaticity coordinates (x, y), (u, v), (u′, v′)
● Relative spectral power distribution P (λ)
● Color rendering index Ra, Ri (i=1~15)
● Color rendering index (long bar diagram)
Remote sensing field
By placing the spectrometer on the artificial satellite or aircraft, the electromagnetic radiation information detection of the ground object can be realized. Various substances on the surface have specific electromagnetic wave reflection, absorption, transmission and radiation characteristics. For example, various rock mines, different types of soil, different types of water bodies, different types of vegetation, urban buildings, and gas components in the atmosphere all have different effects on electromagnetic radiation. Therefore, through the establishment of a spectral database of various substances, various types of ground objects can be accurately classified, so as to realize applications in surveying and mapping, geological prospecting, atmospheric and water environmental monitoring and so on.
Professional spectral measurement of photographic fill light
The following are tested by professional testing equipment, two-color intelligent spectrometer, and the lighting products are provided by the American photography fill light brand VLOGLITE. The following are product specifications.
| Model: | R66 RGB | Color Temperature | 2500-9000K±200K |
| Beads | White 18PCS | Work Time | 2.5H~10H |
| Yellow 18PCS | |||
| RGB 30PCS | |||
| CRI | ≥95 | Power | 5W |
| Voltage | 3.7v | Charge Port | Type-C |
| Battery Capacity |
2000mAh | Beam Angle | 120° |
| Illuminance | 500LUX/0.5 m | Charging Time | 3H (5V/2A) |
Features of the VLOGLITE-R66RGB fill light
- High quality
- Select 66pcs high brightness beads,18pcs white+18pcs yellow+30RGB
- RGB full color ,Full color ajustable 0°~359°
- Dual color temperature: 2500-9000K±200K
- Stepless dimming from 0% to 100%
- CRI≥95
- Illuminance up to 800LUX/0.5 m
- Three modes:CCT mode/RGB mode/Effects mode
- 20-effect modes
Allowing you to simulate a more ideal scene lighting effect. It's a photography light that can make you look cool.
- Magnet function
- Built-in 2000mAh Lithium Battery
- Portable&Light
- Suitable for Various Scenarios
Vloglite profile
Vloglite was founded by tony·Zhang and is a consumer-grade video fill light brand from China. From video fill light camera accessories, everything vloglite does is to shoot wonderful lives, share experiences, and deliver happiness. vloglite believes that sharing will make the experience more meaningful and interesting. The main products of vloglite include video fill light, photography accessories, camera accessories and so on.Vloglite brand video fill light wholesale and retail. Welcome to cooperate with online and offline agents and distributors. You can go to the following website to place an order.
Photography VLOG enthusiasts and wholesale agents
Order me: www.vloglite.com; service@vloglite.com


